Visualise Your Market. Optimise Your Network. Drive Smarter Growth.
For automotive OEMs, understanding how Primary Market Areas perform isn’t just helpful it’s mission-critical. Static spreadsheets and broad regional reporting no longer provide the clarity needed to manage modern dealer networks.
A Primary Market Area (PMA) defines the geographic territory allocated to each dealership. But while PMAs are clearly defined, performance within them is rarely evenly distributed.
Op2ma’s PMA Mapping tool transforms complex sales and share data into a powerful, interactive visual experience — giving OEMs and dealers a shared, data-driven view of opportunity.
PMA Mapping overlays your brand’s PMAs across Australia, with colour intensity reflecting sales volume or market share performance. Instantly, you can see:
High-performing regions
Underpenetrated postcodes
Market share gaps
Growth opportunities within existing territories
No guesswork. No assumptions. Just clear, actionable insight.
Why OEMs Use PMA Mapping:
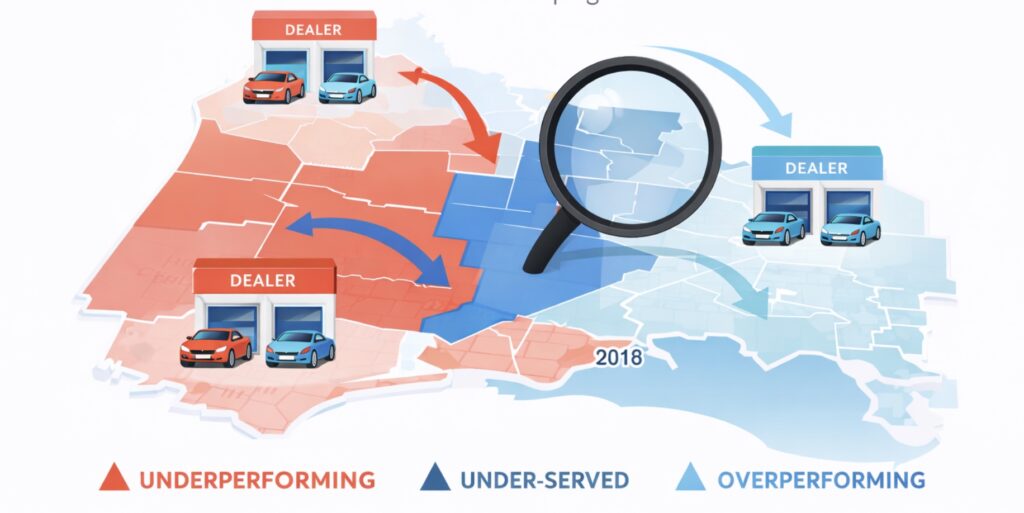
1. Optimise Dealer Network Performance
Identify which PMAs are overperforming, underperforming, or under-served. Support dealers with targeted strategies rather than blanket national campaigns.
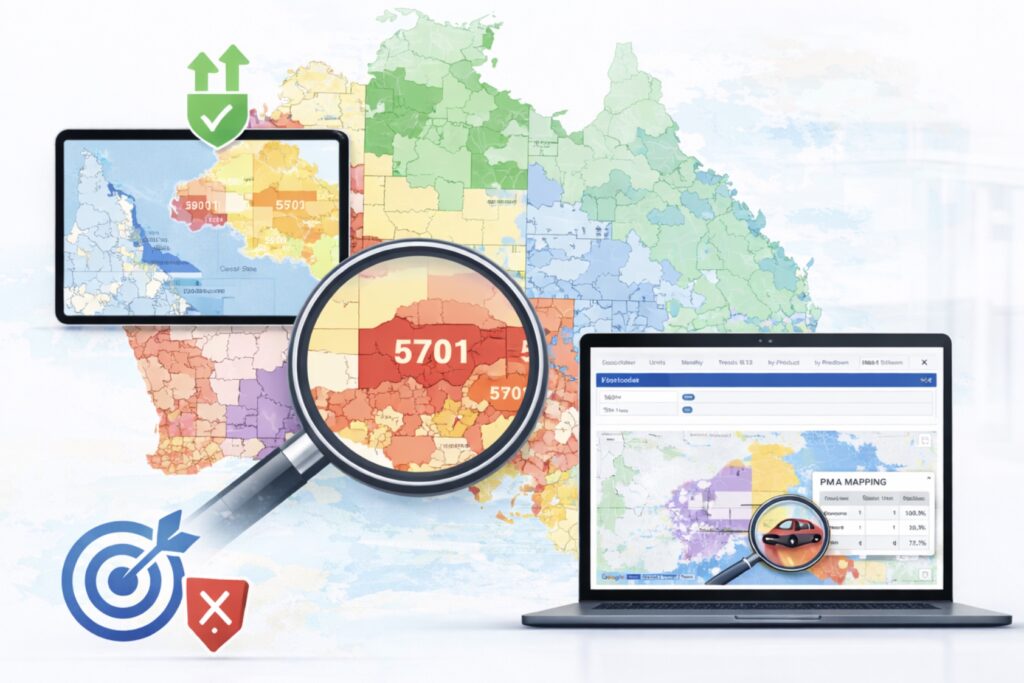
2. Improve Market Share with Precision
Drill down to postcode level to understand exactly where your brand is winning and where it isn’t. Align marketing spend and sales initiatives accordingly.
3. Strengthen OEM–Dealer Collaboration
PMA Mapping provides a shared visual reference point. It removes ambiguity around territories and enables data-backed discussions about opportunity, performance, and accountability.
4. Align Inventory & Model Strategy
See which segments or models are resonating in specific areas. Allocate stock and marketing support based on real demand patterns — not assumptions.
How It Works:
Simple Setup
OEMs upload:
PMA structure by postcode
Sales data
Market share data
That’s it. The system does the rest.
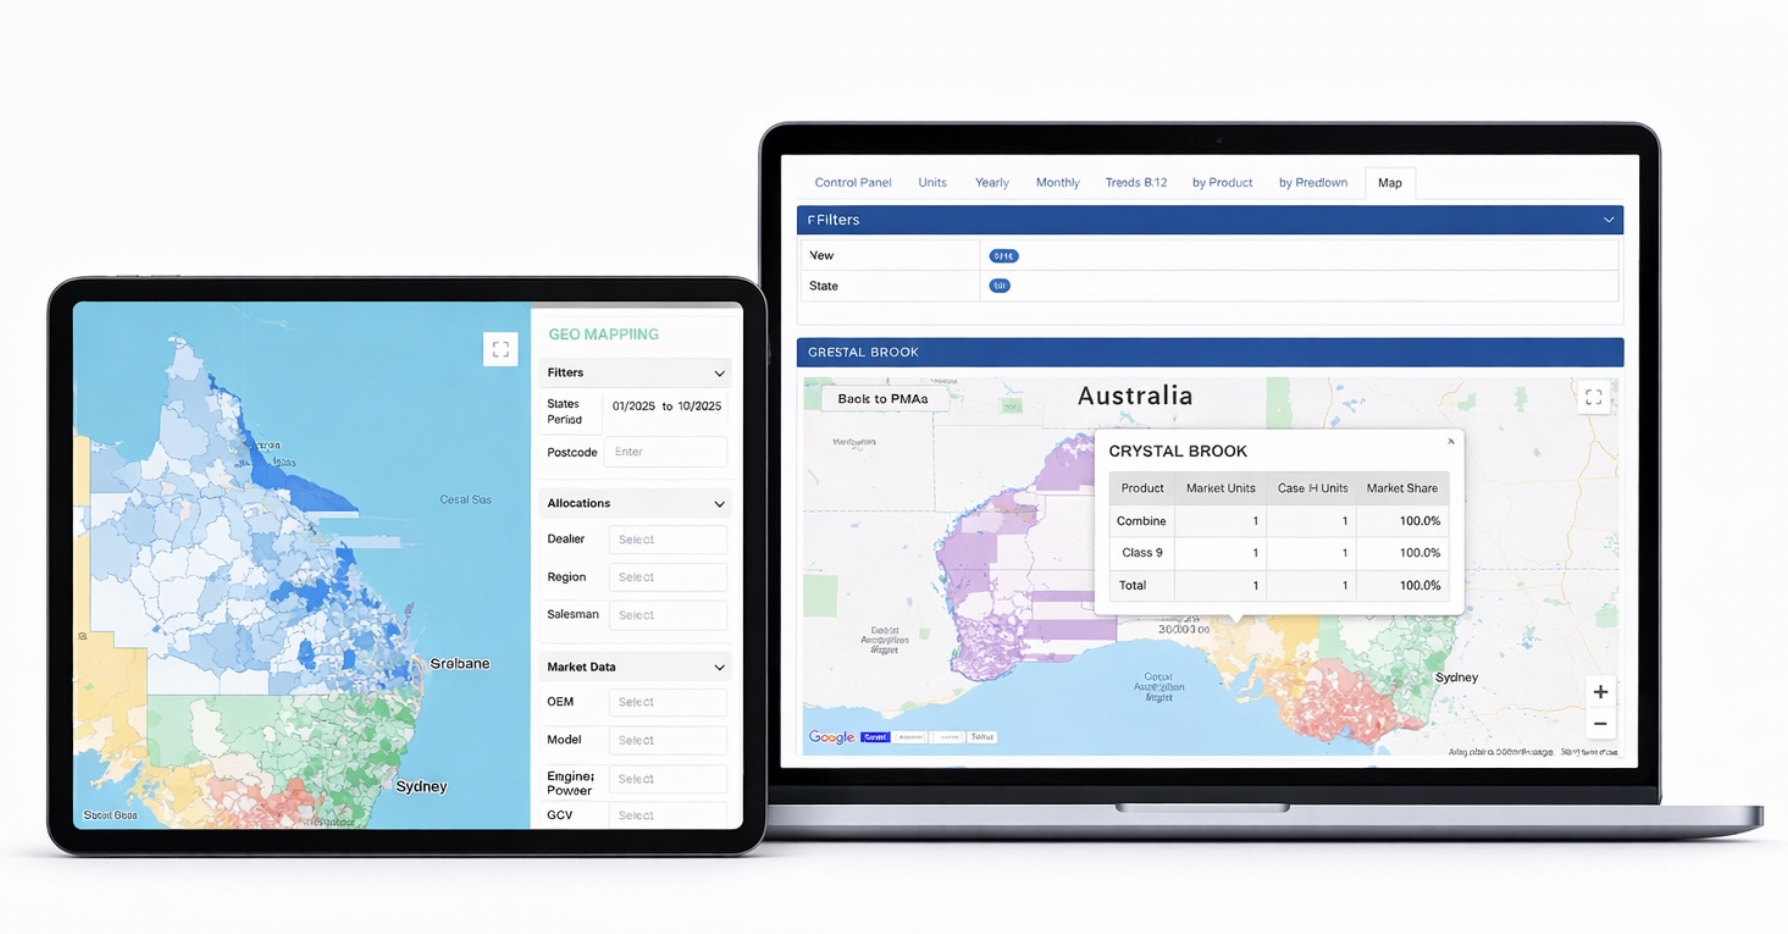
Interactive Visualisation
View PMAs across Australia
Colour intensity reflects performance (volume or share)
Drill down from PMA to postcode level
Advanced Filtering
Toggle between:
Sales
Market share
Segment
Model
Switch perspectives instantly to uncover deeper insights.
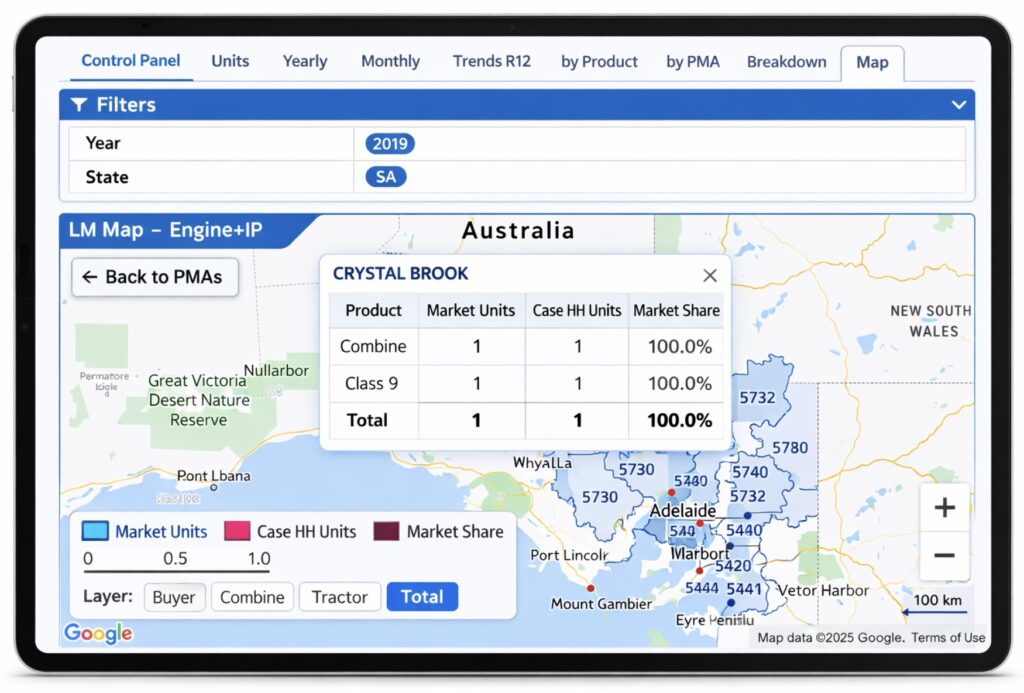
Dual View: Map + Data Table
All visual insights are supported by full data tables, allowing teams to see the numbers behind the map.
In Action
OEM implemented PMA Mapping to improve the quality of discussions with their dealer network.
The result?
More productive performance reviews
Clear identification of high-opportunity postcodes
Better-targeted local marketing strategies
Reduced confusion around which models to promote in specific areas
Both the OEM and its dealers found the tool intuitive, practical, and immediately valuable. It eliminated uncertainty and replaced it with clarity.
Ready to See Your Market Differently?
Unlock hidden opportunity inside your existing PMAs.
Book a demo of Op2ma’s PMA Mapping tool today and start turning geographic data into measurable sales growth.